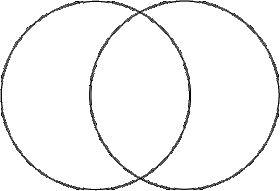
I've used venn diagrams with most of my classes this year.
I find them a great way to get students thinking about how they might categorise words and phrases.
For example, with my younger students when we learn colours and adjective endings in French we use a venn diagram to separate adjectives which are masculine, feminine or both.
When describing people and characteristics we had a positive, negative or possibly both diagram to complete.
I have used them when teaching phonics and got the students to fill in words which contain a certain sound or sounds.
My 6th form students used them to compare and contrast characters from the Maupassant short stories they had read.
I've even got students to make up their own categories for venn diagrams. Some of these were really good, for example one year 7 student made a "J'adore" and "Je déteste" diagram when we learned words for foods.
They require very little preparation, are very easy to make and can be done on mini-whiteboards rather than using a lot of paper.
And the best thing about Venn diagrams, of course, is that every time you use one you can tick the 'Numeracy' box on your planning. Carroll diagrams are another way of organising data, and are something else that students will be familiar with from KS2 maths. If you're after a different sort of activity, students need to practise reading data from a Venn diagram as much as making them.
ReplyDelete